 |
| Market Cap | 87.97M | EPS (ttm) | - |
| P/E | - | EPS this Y | - |
| Forward P/E | - | EPS next Y | - |
| PEG | - | EPS past 5Y | - |
| P/S | - | EPS next 5Y | - |
| P/B | 0.44 | EPS Q/Q | - |
| Dividend | - | Sales Q/Q | - |
| Insider Own | 11.71% | Inst Own | 17.97% |
| Insider Trans | 13.30% | Inst Trans | - |
| Short Float | 0.52% | Earnings | - |
| Analyst Recom | - | Target Price | - |
| Avg Volume | 12.57K | 52W Range | 8.01 - 10.00 |
|
|
|
Apr-30-24 04:15PM
|
SR BANCORP, INC. ANNOUNCES QUARTERLY FINANCIAL RESULTS
(PR Newswire) |
|
Jan-31-24 04:43PM
|
SR BANCORP, INC. ANNOUNCES QUARTERLY FINANCIAL RESULTS
(PR Newswire) |
|
Dec-07-23 11:00AM
|
Hedge Fund and Insider Trading News: Chris Hohn, Ray Dalio, Warren Buffet, Third Point LLC, Tidan Capital, SR Bancorp Inc (SRBK), Visa Inc (V), and More
(Insider Monkey) |
|
Sep-19-23 08:32PM
|
SOMERSET SAVINGS BANK, SLA ANNOUNCES YEAR END FINANCIAL RESULTS
(PR Newswire) |
|
SR Bancorp, Inc. is a bank holding company that engages in the provision of deposit and loan products and services through its subsidiary. The company was founded on July 20, 2022 and is headquartered in Bound Brook, NJ. |
| Insider Trading |
Relationship |
Date |
Transaction |
Cost |
#Shares |
Value ($) |
#Shares Total |
SEC Form 4 |
| Taylor William P | CEO | May 17 '24 | Buy | 9.20 | 5,000 | 45,981 | 15,200 | May 20 09:39 AM | | Taylor William P | CEO | Feb 15 '24 | Buy | 9.50 | 5,200 | 49,400 | 10,200 | Feb 16 11:57 AM | | Lebovitz Marc | Director | Dec 19 '23 | Buy | 9.76 | 5,000 | 48,796 | 10,500 | Dec 19 03:58 PM | | Lupo Thomas | Director | Dec 11 '23 | Buy | 9.60 | 2,500 | 23,991 | 12,500 | Dec 11 05:41 PM | | Orbach David M | Executive Chair | Dec 01 '23 | Buy | 9.62 | 20,000 | 192,480 | 100,000 | Dec 01 03:48 PM |
|
|
 |
 |
| Market Cap | 191.98M | EPS (ttm) | -0.29 |
| P/E | - | EPS this Y | 173.33% |
| Forward P/E | 17.74 | EPS next Y | 30.49% |
| PEG | - | EPS past 5Y | -17.86% |
| P/S | 0.67 | EPS next 5Y | 15.00% |
| P/B | 2.90 | EPS Q/Q | 68.31% |
| Dividend | - | Sales Q/Q | -1.97% |
| Insider Own | 16.52% | Inst Own | 47.48% |
| Insider Trans | -1.93% | Inst Trans | 2.23% |
| Short Float | 0.12% | Earnings | May 09/a |
| Analyst Recom | 1.00 | Target Price | 14.00 |
| Avg Volume | 46.60K | 52W Range | 5.02 - 10.85 |
|
|
|
|
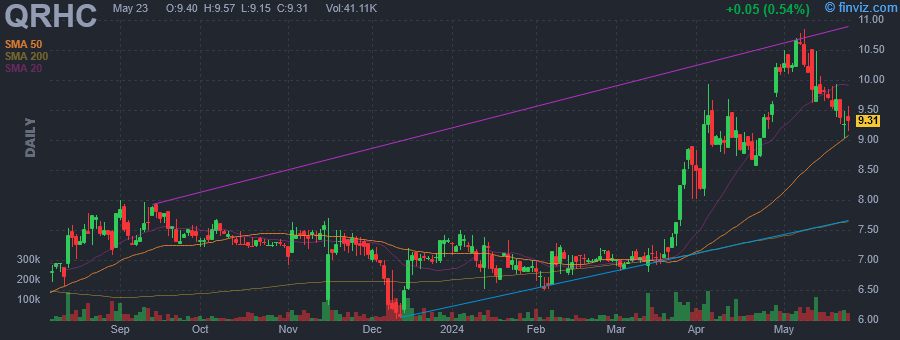
Quest Resource Holding Corp. engages in the provision of waste and recycling services to customers from across multiple industry sectors that are typically larger, multi-location businesses. It focuses on the waste streams and recyclables from big box, food chain, and other retailers, automotive repair, maintenance, and tire operations, truck and bus fleet operators, manufacturing plants, multi-family and commercial properties, and construction and demolition projects. The company was founded in July 2002 and is headquartered in The Colony, TX. |
| Insider Trading |
Relationship |
Date |
Transaction |
Cost |
#Shares |
Value ($) |
#Shares Total |
SEC Form 4 |
| Culpepper Glenn | Director | May 16 '24 | Buy | 9.75 | 4,000 | 39,000 | 4,000 | May 20 09:01 AM | | WYNNEFIELD PARTNERS SMALL CAP | 10% Owner | Mar 13 '24 | Buy | 6.94 | 15,658 | 108,623 | 1,440,256 | Mar 15 04:15 PM | | WYNNEFIELD PARTNERS SMALL CAP | 10% Owner | Mar 13 '24 | Buy | 6.94 | 14,918 | 103,489 | 1,294,093 | Mar 15 04:15 PM | | Dunning Audrey | Director | Dec 20 '23 | Buy | 6.99 | 2,000 | 13,980 | 2,000 | Dec 22 04:03 PM | | Sweitzer David P | EVP and COO | Dec 14 '23 | Option Exercise | 2.39 | 21,033 | 50,269 | 29,544 | Dec 15 04:58 PM |
|
|
|
 |
| Market Cap | 701.60M | EPS (ttm) | -3.26 |
| P/E | - | EPS this Y | - |
| Forward P/E | - | EPS next Y | - |
| PEG | - | EPS past 5Y | - |
| P/S | - | EPS next 5Y | - |
| P/B | - | EPS Q/Q | - |
| Dividend | 9.95% | Sales Q/Q | - |
| Insider Own | 7.50% | Inst Own | 58.77% |
| Insider Trans | 9.05% | Inst Trans | - |
| Short Float | 0.15% | Earnings | - |
| Analyst Recom | - | Target Price | - |
| Avg Volume | 137.35K | 52W Range | 10.63 - 14.35 |
|
|
|
|
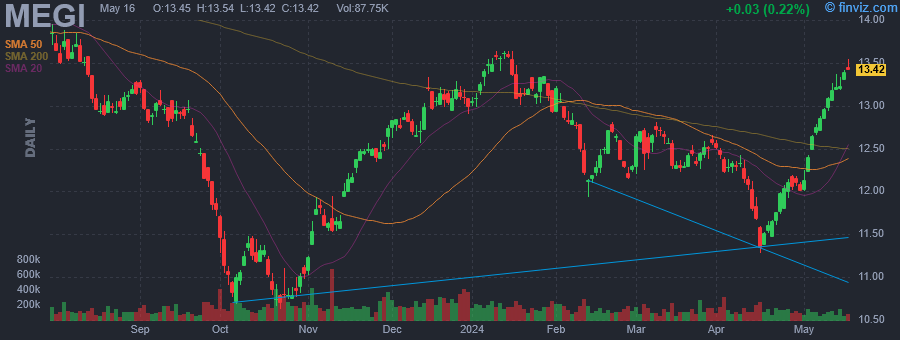
The investment objective of MainStay CBRE Global Infrastructure Megatrends Fund (MEGI) is to seek a high level of total return with an emphasis on current income. |
| Insider Trading |
Relationship |
Date |
Transaction |
Cost |
#Shares |
Value ($) |
#Shares Total |
SEC Form 4 |
| Saba Capital Management, L.P. | 10% Owner | May 17 '24 | Buy | 13.43 | 3,280 | 44,050 | 5,631,502 | May 20 08:55 AM | | Saba Capital Management, L.P. | 10% Owner | May 15 '24 | Buy | 13.38 | 1,508 | 20,177 | 5,628,222 | May 17 12:58 PM | | Saba Capital Management, L.P. | 10% Owner | May 03 '24 | Buy | 12.53 | 9,828 | 123,145 | 5,626,714 | May 07 05:10 PM | | Saba Capital Management, L.P. | 10% Owner | May 02 '24 | Buy | 12.33 | 12,874 | 158,736 | 5,616,886 | May 03 01:10 PM | | Saba Capital Management, L.P. | 10% Owner | Apr 25 '24 | Buy | 12.03 | 45,097 | 542,517 | 5,603,993 | Apr 26 11:47 AM |
|
|
| |
 |
| Market Cap | 183.30M | EPS (ttm) | -3.21 |
| P/E | - | EPS this Y | 34.29% |
| Forward P/E | - | EPS next Y | 19.55% |
| PEG | - | EPS past 5Y | 38.92% |
| P/S | 52.37 | EPS next 5Y | - |
| P/B | - | EPS Q/Q | -114.59% |
| Dividend | - | Sales Q/Q | - |
| Insider Own | 5.40% | Inst Own | 49.81% |
| Insider Trans | 2.57% | Inst Trans | 14.04% |
| Short Float | 8.59% | Earnings | May 15/b |
| Analyst Recom | 1.00 | Target Price | 15.75 |
| Avg Volume | 707.97K | 52W Range | 2.83 - 9.01 |
|
|
|
|
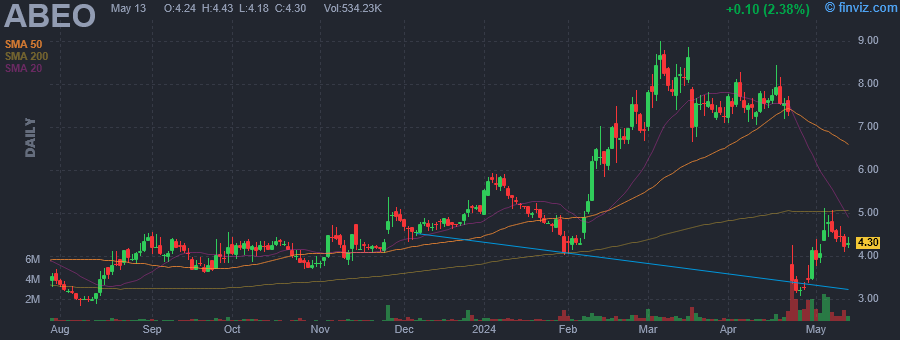
Abeona Therapeutics, Inc. is a clinical stage biopharmaceutical company, which engages in the development of gene therapy for severe and life-threatening rare diseases. It programs include EB-101 (gene-corrected skin grafts) for recessive dystrophic epidermolysis bullosa (RDEB), ABO-102 (AAV-SGSH), an adeno-associated virus (AAV) based gene therapy for Sanfilippo syndrome type A (MPS IIIA), and ABO-101 (AAV NAGLU), an AAV based gene therapy for Sanfilippo syndrome type B (MPS IIIB). The company was founded in 1974 and is headquartered in Cleveland, OH. |
| Insider Trading |
Relationship |
Date |
Transaction |
Cost |
#Shares |
Value ($) |
#Shares Total |
SEC Form 4 |
| Alland Leila | Director | May 16 '24 | Buy | 4.71 | 11,000 | 51,799 | 82,857 | May 20 08:30 AM | | Charles Faith L. | Director | Apr 26 '24 | Buy | 3.28 | 7,550 | 24,764 | 78,323 | Apr 29 08:30 AM | | Seshadri Vishwas | Chief Executive Officer | Apr 25 '24 | Buy | 3.20 | 10,000 | 32,000 | 538,260 | Apr 29 08:30 AM | | O'Malley Brendan M. | SVP, General Counsel | Apr 25 '24 | Buy | 3.24 | 8,600 | 27,864 | 188,718 | Apr 26 08:30 AM | | Vazzano Joseph Walter | Chief Financial Officer | Apr 25 '24 | Buy | 3.14 | 5,608 | 17,609 | 233,868 | Apr 26 08:30 AM |
|
|
|
 |
| Market Cap | 739.83M | EPS (ttm) | 2.71 |
| P/E | 18.41 | EPS this Y | - |
| Forward P/E | - | EPS next Y | - |
| PEG | - | EPS past 5Y | -7.81% |
| P/S | 4.34 | EPS next 5Y | - |
| P/B | 1.16 | EPS Q/Q | -30.94% |
| Dividend | 4.26% | Sales Q/Q | 9.92% |
| Insider Own | 24.20% | Inst Own | 12.63% |
| Insider Trans | 0.80% | Inst Trans | - |
| Short Float | 1.56% | Earnings | Apr 26/b |
| Analyst Recom | - | Target Price | - |
| Avg Volume | 18.96K | 52W Range | 42.91 - 85.00 |
|
|
|
May-15-24 10:11AM
|
Is Burke & Herbert Bank & Trust Co (NASDAQ:BHRB) the Best Financial Dividend Stock Insiders are Buying in 2024?
(Insider Monkey) |
|
08:50AM
|
10 Best Financial Dividend Stocks Insiders are Buying in 2024
(Insider Monkey) |
|
May-13-24 09:54AM
|
BHRB Stock Earnings: Burke & Herbert Financial Reported Results for Q4 2023
(InvestorPlace) |
|
May-03-24 07:30AM
|
Burke & Herbert Financial Services Corp. Completes Merger of Equals with Summit Financial Group, Inc.
(PR Newswire) +5.92% |
|
Apr-26-24 01:53PM
|
BHRB Stock Earnings: Burke & Herbert Financial Reported Results for Q1 2024
(InvestorPlace) |
|
08:30AM
|
Burke & Herbert Financial Services Corp. Announces First Quarter 2024 Results and Declares Common Stock Dividend
(PR Newswire) |
|
Apr-19-24 08:30AM
|
Burke & Herbert Financial Services Corp. and Summit Financial Group, Inc. Announce Receipt of Regulatory Approvals and Closing Date for Merger of Equals
(PR Newswire) |
|
Feb-01-24 12:02PM
|
Hedge Fund and Insider Trading News: David Einhorn, Crispin Odey, Bill Ackman, Stanley Druckenmiller, Ken Griffin, Burke Herbert Financial Services (BHRB), KalVista Pharmaceuticals, Inc. (KALV), and More
(Insider Monkey) |
|
Jan-26-24 08:00AM
|
Burke & Herbert Financial Services Corp. Announces Fourth Quarter and Full Year 2023 Results and Declares Common Stock Dividend
(PR Newswire) |
|
Dec-06-23 02:07PM
|
Burke & Herbert Financial Services Corp. and Summit Financial Group, Inc. Announce Receipt of Shareholder Approval for Merger
(PR Newswire) |
|
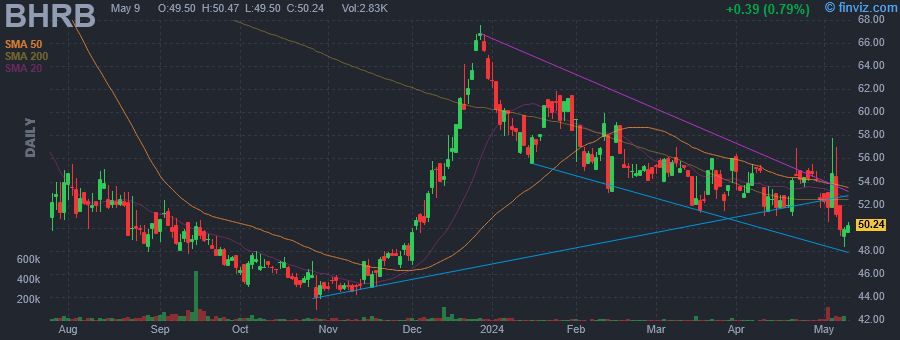
Burke Herbert Financial Services Corp. is a bank holding company, which engages in the provision of banking products and financial services to small to medium-sized businesses, their owners and employees, professional corporations, non-profits, and individuals. It operates through the following loan portfolio segments: Commercial Real Estate, Owner-Occupied Commercial Real Estate, Acquisition, Construction, and Development, Commercial and Industrial, Single Family Residential (1-4 Units), and Consumer Non-Real Estate and Other. The Commercial Real Estate segment includes leasing of the real estate collateral or income generated from the sale of the collateral. The Owner-Occupied Commercial Real Estate segment focuses on the operations of the business that occupies the property and the value of the collateral. The Acquisition, Construction, and Development segment offers creditworthiness of the borrower, project completion within budget, sale after completion, and the value of the collateral. The Commercial and Industrial segment is involved in the operations of the business and the value of the collateral. The Single Family Residential (1-4 Units) segment provides loans for investment purpose carry risk associated with the continued creditworthiness of the borrower, the value of the collateral, and either the net operating income generated from the lease of the real estate collateral or income generated from the sale of the collateral. The Consumer Non-Real Estate and Other segment covers loans carry risk associated with the creditworthiness of the borrower and the value of the collateral. The company was founded on September 14, 2022 and is headquartered in Alexandria, VA. |
| Insider Trading |
Relationship |
Date |
Transaction |
Cost |
#Shares |
Value ($) |
#Shares Total |
SEC Form 4 |
| HINKLE GARY L | Director | May 17 '24 | Buy | 50.54 | 470 | 23,753 | 220,130 | May 20 08:19 AM | | HINKLE GARY L | Director | May 16 '24 | Buy | 50.29 | 210 | 10,562 | 219,660 | May 17 12:55 PM | | HINKLE GARY L | Director | May 15 '24 | Buy | 50.23 | 600 | 30,135 | 219,450 | May 15 05:17 PM | | HINKLE GARY L | Director | May 14 '24 | Buy | 49.50 | 2,779 | 137,560 | 218,850 | May 14 03:15 PM | | HINKLE GARY L | Director | May 13 '24 | Buy | 49.65 | 613 | 30,435 | 216,071 | May 14 09:33 AM |
|
|
| |
 |
| Market Cap | 42.86M | EPS (ttm) | 0.07 |
| P/E | 4.56 | EPS this Y | -279.60% |
| Forward P/E | - | EPS next Y | - |
| PEG | - | EPS past 5Y | - |
| P/S | 25.66 | EPS next 5Y | - |
| P/B | 0.51 | EPS Q/Q | 1.51% |
| Dividend | - | Sales Q/Q | 1285.21% |
| Insider Own | 8.61% | Inst Own | 6.85% |
| Insider Trans | 12.42% | Inst Trans | -7.01% |
| Short Float | 0.81% | Earnings | Apr 30/b |
| Analyst Recom | 3.00 | Target Price | 4.00 |
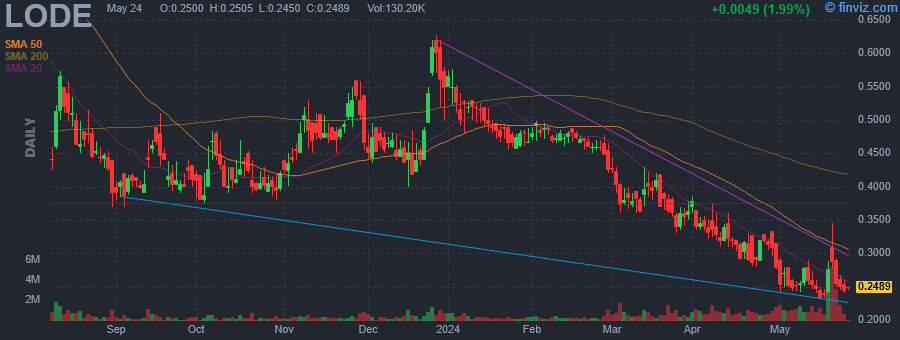
| Avg Volume | 868.95K | 52W Range | 0.23 - 0.99 |
|
|
|
|
Comstock, Inc. engages in the innovation, commercialization, and development of technologies that enable systemic decarbonization by converting under-utilized natural resources into renewable energy products. It operates through the following segments: Fuels, Metals, Mining, Strategic Investments, and Corporate and Other. The Fuels segment develops and commercializes technologies that extract and convert wasted and unused lignocellulosic biomass into intermediates for refining into advanced renewable fuels. The Metals segment is involved in recycling metals from other electronic devices, such as end-of-life batteries and fuel cells at later stages of development and production. The Mining segment focuses on leases, licenses, and related fees. It is administered by Comstock Mining LLC, and various other subsidiaries that collectively own or control twelve square miles of properties of patented mining claims, unpatented mining claims, and surface parcels in Northern Nevada. The Strategic Investments segment represents investments and projects that are strategic to plans and the ability to produce and maximize throughput in fuels, metals, and mining segments. The Corporate and Other segment includes corporate functions and services, including research and development activities that are ongoing outside of the business activities related to fuels, metals, mining, and strategic investments segments. The company was founded in 1999 and is headquartered in Virginia City, NV. |
| Insider Trading |
Relationship |
Date |
Transaction |
Cost |
#Shares |
Value ($) |
#Shares Total |
SEC Form 4 |
| DEGASPERIS CORRADO | Executive Chairman and CEO | May 17 '24 | Buy | 0.40 | 1,250,000 | 500,000 | 1,358,180 | May 20 07:28 AM | | BOBBILI RAHUL | Chief Engineering Officer | May 13 '24 | Buy | 0.26 | 25,000 | 6,403 | 1,050,000 | May 13 04:09 PM | | MCCARTHY WILLIAM JOSEPH | Chief Operating Officer | May 09 '24 | Buy | 0.26 | 15,000 | 3,854 | 1,542,000 | May 10 12:41 PM | | BOBBILI RAHUL | Chief Engineering Officer | May 08 '24 | Buy | 0.25 | 15,000 | 3,768 | 1,025,000 | May 08 04:08 PM | | BOBBILI RAHUL | Chief Engineering Officer | May 07 '24 | Buy | 0.25 | 10,000 | 2,500 | 1,010,000 | May 08 04:08 PM |
|
|
|
 |
| Market Cap | 999.76M | EPS (ttm) | -1.00 |
| P/E | - | EPS this Y | 64.54% |
| Forward P/E | - | EPS next Y | 47.00% |
| PEG | - | EPS past 5Y | 8.72% |
| P/S | 7.89 | EPS next 5Y | - |
| P/B | 1.72 | EPS Q/Q | -24.79% |
| Dividend | - | Sales Q/Q | 81.30% |
| Insider Own | 3.26% | Inst Own | 69.17% |
| Insider Trans | 14.73% | Inst Trans | -1.58% |
| Short Float | 3.08% | Earnings | May 08/a |
| Analyst Recom | 1.00 | Target Price | 3.58 |
| Avg Volume | 2.51M | 52W Range | 1.57 - 3.16 |
|
|
|
|
Standard BioTools Inc. engages in the provision of biotechnology tools and services for clinical research. It sells preparatory and analytical instruments for mass cytometry, polymerase chain reaction, library prep, single cell genomics, and consumables including integrated fluidic circuits (IFCs), assays, and reagents. The company was founded by Stephen D. Quake and Gajus Vincent Worthington on May 19, 1999 and is headquartered in South San Francisco, CA. |
| Insider Trading |
Relationship |
Date |
Transaction |
Cost |
#Shares |
Value ($) |
#Shares Total |
SEC Form 4 |
| Casdin Partners Master Fund, L | Director | May 17 '24 | Buy | 2.56 | 352,072 | 902,044 | 45,375,821 | May 17 08:11 PM | | Casdin Partners Master Fund, L | Director | May 16 '24 | Buy | 2.54 | 500,000 | 1,270,950 | 45,023,749 | May 17 08:11 PM | | Black Jeffrey G. | SVP & Chief Financial Officer | May 15 '24 | Option Exercise | 0.00 | 52,631 | 0 | 138,615 | May 16 09:07 PM | | Casdin Partners Master Fund, L | Director | May 15 '24 | Buy | 2.57 | 500,000 | 1,282,550 | 44,523,749 | May 17 08:11 PM | | Egholm Michael | President & CEO | Apr 04 '24 | Option Exercise | 0.00 | 196,512 | 0 | 422,030 | Apr 05 06:59 PM |
|
|
| |
 |
| Market Cap | 188.83M | EPS (ttm) | -0.34 |
| P/E | - | EPS this Y | 75.82% |
| Forward P/E | - | EPS next Y | -13.53% |
| PEG | - | EPS past 5Y | -19.79% |
| P/S | 14.01 | EPS next 5Y | - |
| P/B | 4.18 | EPS Q/Q | 85.73% |
| Dividend | - | Sales Q/Q | -37.21% |
| Insider Own | 14.11% | Inst Own | 37.61% |
| Insider Trans | -0.79% | Inst Trans | -6.50% |
| Short Float | 9.73% | Earnings | May 08/b |
| Analyst Recom | 1.60 | Target Price | 3.44 |
| Avg Volume | 2.47M | 52W Range | 0.36 - 1.92 |
|
|
|
|
Veru, Inc. is a late clinical stage biopharmaceutical company focused on developing novel medicines for the treatment of metabolic diseases, oncology, and ARDS. The company's drug development program includes two late-stage novel small molecules, enobosarm and sabizabulin. Enobosarm, a selective androgen receptor modulator (SARM), is being developed for two indications: (i) Phase 2b clinical study of enobosarm as a treatment to augment fat loss and to prevent muscle loss in sarcopenic obese or overweight elderly patients receiving a GLP-1 RA who are at-risk for developing muscle atrophy and muscle weakness and (ii) subject to the availability of sufficient funding, Phase 3 clinical trial of enobosarm for the treatment of androgen receptor positive (AR+), estrogen receptor positive (ER+) and human epidermal growth factor receptor 2 negative (HER2-) metastatic breast cancer in the 2nd line setting. Sabizabulin, a microtubule disruptor, is being developed as a Phase 3 clinical trial for the treatment of hospitalized patients with viral-induced ARDS. The company was founded by William R. Gargiulo, Jr., O. B. Parrish, and Harry Fisch in 1971 and is headquartered in Miami, FL. |
| Insider Trading |
Relationship |
Date |
Transaction |
Cost |
#Shares |
Value ($) |
#Shares Total |
SEC Form 4 |
| STEINER MITCHELL SHUSTER | President and CEO | May 17 '24 | Sale | 1.32 | 28,066 | 36,988 | 7,012,892 | May 17 07:41 PM | | STEINER MITCHELL SHUSTER | President and CEO | May 16 '24 | Sale | 1.41 | 59,788 | 84,128 | 7,040,958 | May 17 07:41 PM | | FISCH HARRY | Chief Corporate Officer | May 15 '24 | Buy | 1.49 | 6,711 | 9,999 | 770,736 | May 17 07:46 PM | | STEINER MITCHELL SHUSTER | President and CEO | May 15 '24 | Sale | 1.50 | 84,021 | 125,813 | 7,100,746 | May 17 07:41 PM |
|
|
|
 |
| Market Cap | 49.61B | EPS (ttm) | 4.52 |
| P/E | 17.35 | EPS this Y | 4.38% |
| Forward P/E | 15.20 | EPS next Y | 7.20% |
| PEG | 2.94 | EPS past 5Y | 22.84% |
| P/S | 3.65 | EPS next 5Y | 5.90% |
| P/B | 1.76 | EPS Q/Q | -17.74% |
| Dividend | 3.21% | Sales Q/Q | -45.60% |
| Insider Own | 0.04% | Inst Own | 90.34% |
| Insider Trans | -39.89% | Inst Trans | -0.24% |
| Short Float | 1.82% | Earnings | May 07/b |
| Analyst Recom | 1.59 | Target Price | 84.03 |
| Avg Volume | 3.21M | 52W Range | 63.75 - 78.40 |
|
|
|
|
Sempra is an energy-service holding company, which engages in the development and operation of energy infrastructure, and provision of electric and gas services. It operates through the following segments: Sempra California, Sempra Texas Utilities, Sempra Infrastructure, and All Other. The Sempra California segment offers natural gas and electric service to Southern California and part of central California through Sempra's wholly owned subsidiaries, SDG&E and SoCalGas. The Sempra Texas Utilities holds investment in Oncor Holdings. The Sempra Infrastructure includes the operating companies of subsidiary, SI Partners, as well as a holding company and certain services companies. The company was founded on October 11, 1996, and is headquartered in San Diego, CA. |
| Insider Trading |
Relationship |
Date |
Transaction |
Cost |
#Shares |
Value ($) |
#Shares Total |
SEC Form 4 |
| MARK RICHARD J | Director | May 17 '24 | Buy | 77.97 | 1,925 | 150,092 | 5,420 | May 17 07:22 PM | | BIRD JUSTIN CHRISTOPHER | Executive Vice President | Mar 08 '24 | Sale | 70.60 | 6,278 | 443,227 | 13,434 | Mar 08 07:40 PM | | Sedgwick Karen L | Executive VP and CFO | Mar 08 '24 | Sale | 70.59 | 3,624 | 255,818 | 39,400 | Mar 08 07:40 PM | | DAY DIANA L | Chief Legal Counsel | Mar 08 '24 | Sale | 70.62 | 3,406 | 240,532 | 14,739 | Mar 08 07:39 PM | | Sedgwick Karen L | Executive VP and CFO | Mar 07 '24 | Sale | 71.21 | 5,158 | 367,301 | 43,024 | Mar 08 07:40 PM |
|
|
|
 |
| Market Cap | 256.86M | EPS (ttm) | 0.25 |
| P/E | 36.84 | EPS this Y | 125.00% |
| Forward P/E | 9.82 | EPS next Y | 59.83% |
| PEG | - | EPS past 5Y | -20.02% |
| P/S | 0.44 | EPS next 5Y | -1.00% |
| P/B | 0.71 | EPS Q/Q | -16.36% |
| Dividend | 1.31% | Sales Q/Q | 8.21% |
| Insider Own | 10.21% | Inst Own | 81.04% |
| Insider Trans | 3.06% | Inst Trans | -4.28% |
| Short Float | 3.76% | Earnings | May 09/a |
| Analyst Recom | 1.00 | Target Price | 18.00 |
| Avg Volume | 206.87K | 52W Range | 8.41 - 18.38 |
|
|
|
|
American Vanguard Corp. is a holding company which engages in the development and marketing of specialty and agricultural products for crop protection and management, turf and ornamentals management, public and animal health. It also acquires and licenses both new and well-established product lines that serve numerous market niches. The company was founded by Herbert A. Kraft and Glenn A. Wintemute in January 1969 and is headquartered in Newport Beach, CA. |
| Insider Trading |
Relationship |
Date |
Transaction |
Cost |
#Shares |
Value ($) |
#Shares Total |
SEC Form 4 |
| Trogele Ulrich | See Remarks | May 16 '24 | Buy | 8.75 | 18,200 | 159,318 | 209,876 | May 17 07:00 PM | | ROSENBLOOM KEITH M | Director | May 15 '24 | Buy | 8.88 | 40,000 | 355,200 | 1,014,155 | May 17 10:28 AM | | Macicek Steven D | Director | May 15 '24 | Buy | 9.01 | 8,500 | 76,624 | 10,044 | May 17 06:26 AM | | Trogele Ulrich | See Remarks | Dec 14 '23 | Buy | 10.72 | 5,000 | 53,625 | 191,676 | Dec 14 08:30 PM | | Trogele Ulrich | See Remarks | Dec 11 '23 | Buy | 10.05 | 2,488 | 25,004 | 186,676 | Dec 12 02:13 PM |
|
|
|
